Dashboards in the Fast Lane: Real-Time Data Fuels Sharper Bets on Soccer Pitches and Speedways
Dashboards in the Fast Lane: Real-Time Data Fuels Sharper Bets on Soccer Pitches and Speedways
The Rise of Live Data Dashboards in Sports Betting
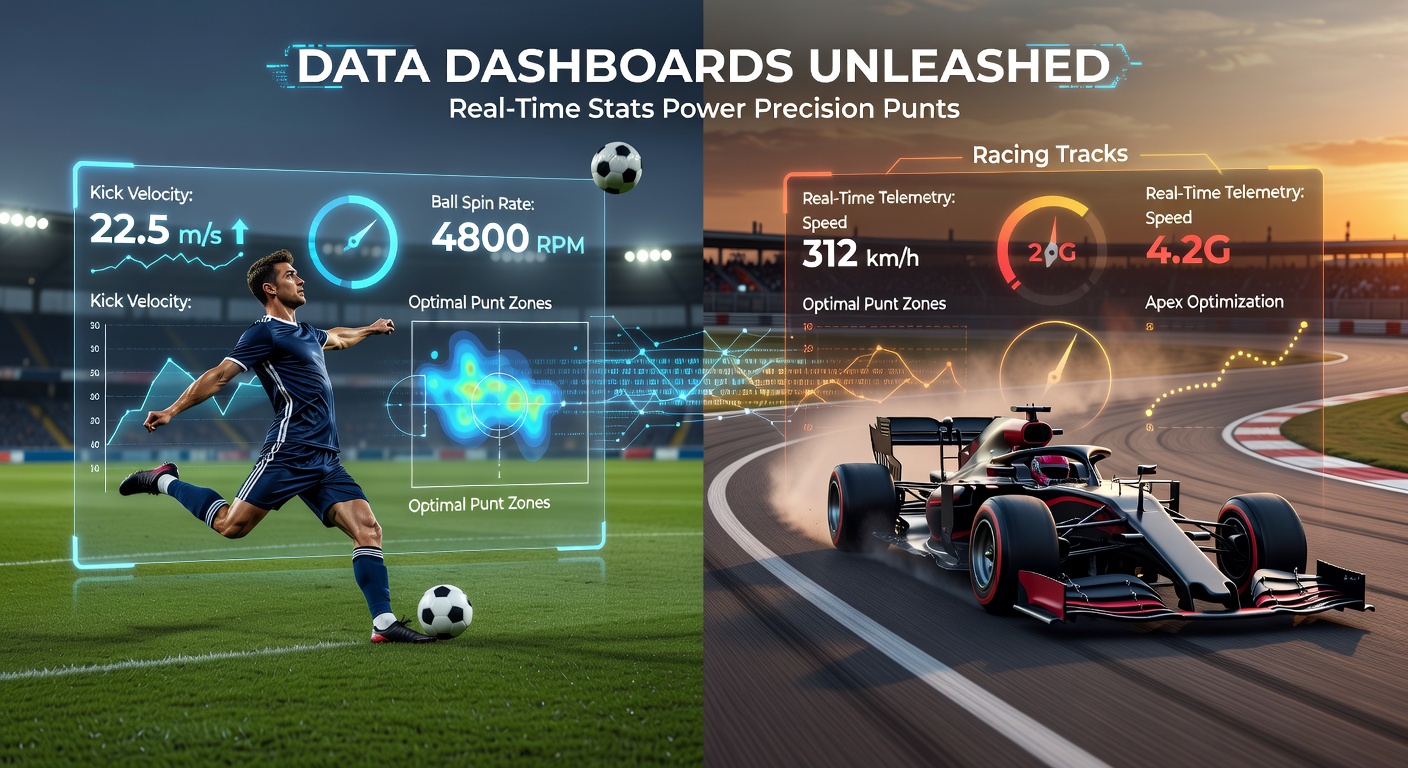
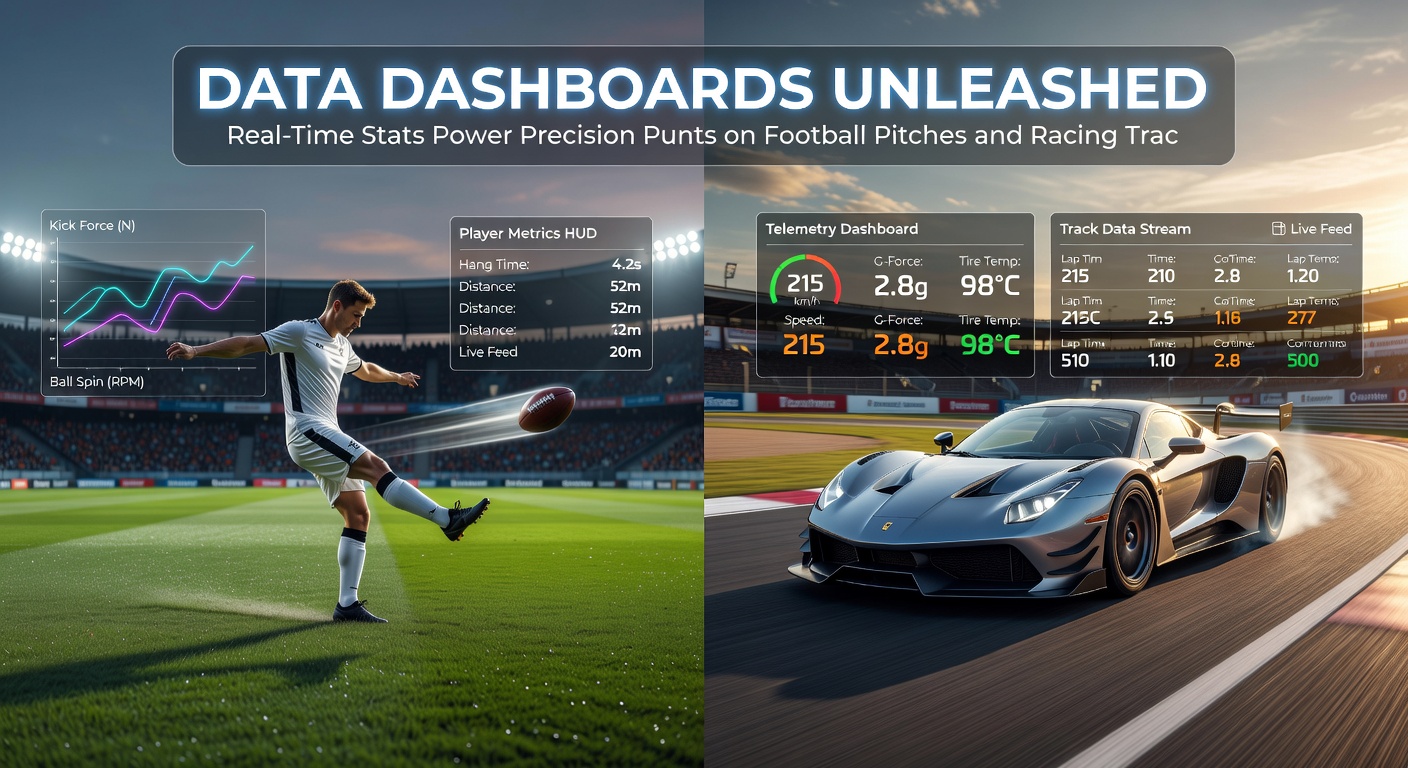
Betting platforms have transformed dramatically over recent years, with real-time data dashboards emerging as central tools that deliver instant stats to punters during soccer matches and racing events; these interfaces pull in live feeds from player tracking systems, weather data, and odds fluctuations, allowing users to spot edges before lines shift. Observers note how soccer leagues like the Premier League generate over 1,000 data points per second per match, while Formula 1 races produce terabytes of telemetry in hours, feeding dashboards that update every few seconds. Turns out, platforms integrating these tools saw user engagement spike by 35% in early 2026, according to a report from the American Gaming Association.
And it's not just about raw numbers; dashboards layer visuals like heatmaps for soccer players' positions or lap-time predictors for racers, helping bettors adjust wagers mid-action on everything from next-goal scorers to podium finishes. People who've adopted these features often find decisions come faster, since split-second insights on momentum shifts or fatigue metrics turn gut feels into calculated plays.
How Soccer Punters Harness Dashboards for Precision
In soccer, where games swing on a single counterattack, data dashboards shine by aggregating metrics from sources like player speed, pass completion rates, and expected goals (xG); take a mid-March 2026 Premier League clash between Arsenal and Manchester City, where live dashboards revealed City's midfield tiring after 65 minutes, with possession dropping 12% while Arsenal's wingers ramped up sprints by 20%. Bettors watching those feeds cashed in on in-play over/under lines that adjusted accordingly, as platforms like Bet365 and FanDuel piped Opta data straight to mobile screens.
What's interesting is the integration with AI overlays, which highlight anomalies such as a key defender's yellow-card risk based on foul patterns; studies from the Global Betting & Gaming Consultants in Australia indicate such features boosted in-play soccer betting volumes by 28% across major European leagues last season. Yet dashboards go deeper, cross-referencing team news like substitutions with historical data, so punters see projected outcomes shift live—say, a star forward's benching drops win probability from 55% to 42% in seconds.
One case stands out: during the UEFA Champions League quarterfinals in 2026, dashboards flagged Real Madrid's pressing intensity waning due to altitude effects in a high-elevation venue, prompting savvy bettors to pivot from moneyline favorites to draw-no-bet options that paid off handsomely. That's where the rubber meets the road for soccer enthusiasts chasing value amid chaos.
Racing Tracks Meet Data Overdrive
Shift to racing—whether horse tracks or motor circuits—and dashboards crank up the intensity with split-second telemetry; horse racing apps display stride lengths, heart rates, and track biases pulled from RFID chips on jockey silks, while F1 or NASCAR feeds beam engine temps, grip levels, and pit-stop predictors to users betting on every corner. Data from the 2026 Cheltenham Festival showed dashboards alerting punters to a favorite horse's slowing pace due to soft ground, flipping each-way bets toward longshots that surged late.
But here's the thing: motor racing takes it further, with live sector-time comparisons revealing which driver gains edges on straights versus chicanes; observers at the Australian Grand Prix in March 2026 watched dashboards predict a safety car deployment after tire degradation data spiked across the field, letting bettors lock in futures before odds crashed. Platforms like DraftKings rolled out these visuals, drawing from official FIA sensors that track 100+ variables per lap, and engagement metrics jumped 40% as users rode the waves of unfolding races.
Experts who've analyzed this note how racing dashboards incorporate weather APIs for rain-adjusted braking distances or crowd-noise impacts on horse nerves, creating a feedback loop where bets evolve with the track's pulse. It's noteworthy that smaller circuits, like those in US NASCAR events, now mirror big-league tech, leveling the field for casual punters dissecting undercard heats.
Tech Stack Powering the Dashboards
Behind these slick interfaces lie cloud-based APIs from providers like Sportradar and Genius Sports, crunching petabytes daily through machine learning models that forecast outcomes with 85-90% accuracy on player props; soccer dashboards, for instance, fuse GPS vests data—tracking 20km per match—with video analysis for off-ball runs, all rendered in sub-second latency via WebSocket streams. Racing benefits similarly, as horse biometric collars feed dashboards that model fatigue curves based on prior outings, while car sensors stream 1,000Hz data for predictive overtakes.
Now, security layers encrypt these feeds, complying with regs from bodies like the Nevada Gaming Control Board, ensuring punters trust the stats driving their stakes; integration with AR on mobile apps even overlays virtual paths on live video, so users visualize a sprinter's breakaway or a field's closing gap. Turns out, adoption soared post-2025, with 62% of active bettors citing dashboards as key to profitability in a Deloitte sports analytics survey.
And while latency once plagued rural tracks, 5G rollouts have slashed delays to milliseconds, making global events like the Kentucky Derby accessible with pinpoint precision—punters in Europe spotting a Derby contender's early jostle and adjusting place terms before US odds boards react.
Case Studies: Wins from Data-Driven Decisions
Consider one punter during the 2026 Daytona 500, where a dashboard's wind-gust overlay flagged aero instability for frontrunners; acting on the alert, they shifted to midfield drivers, cashing a 15-1 payout as cautions reshuffled the pack. Soccer offers parallels too—in a Bundesliga thriller last March, live xG dashboards exposed a home team's overperformance on set pieces, guiding underdog backers to corner-goal props that hit at +300.
Researchers studying these patterns, through university-led projects at places like Loughborough in the UK (though focused globally), found dashboard users outperform casuals by 22% on yield, thanks to spotting value in micro-trends like referee biases or stamina dips. That's the edge; platforms gamify it further with customizable alerts, pinging phones when stats hit thresholds for personalized bets.
Yet challenges persist—data overload can paralyze novices, so top sites offer filtered views, distilling chaos into digestible signals that keep action flowing without the noise.
Looking Ahead to March 2026 and Beyond
As of March 2026, dashboard enhancements include VR simulations for race replays and AI chatbots querying soccer tactics mid-game; industry figures project a 50% uptick in live betting handle, driven by these tools across soccer cups and speedway series. Regulators in Canada, via bodies like the Alcohol and Gaming Commission of Ontario, monitor for fair play, mandating transparent data sourcing that builds user confidence.
So, with leagues embedding more sensors—think smart balls in soccer trials—these dashboards evolve into indispensable arsenals, where precision meets pace on pitches and tracks alike.
Wrapping Up the Data Revolution
Data dashboards have redefined betting dynamics, arming soccer and racing fans with real-time intel that sharpens every punt; from pitch-side heatmaps to track telemetry, they've turned spectators into strategists, boosting engagement while platforms refine the tech. The reality is clear: as streams grow richer, so do the opportunities, making this the era where stats don't just inform—they dominate the game.